Interesting Fibonacci Patterns on Crude Oil
Crude Oil today has taken one terrible pounding and brought world markets down by a huge amount. There is tremendous apprehension as to what will follow as the new day begins in Asia.
Some important developments are revealed on the technical charts. Have a look at these
Fibonacci Patterns.
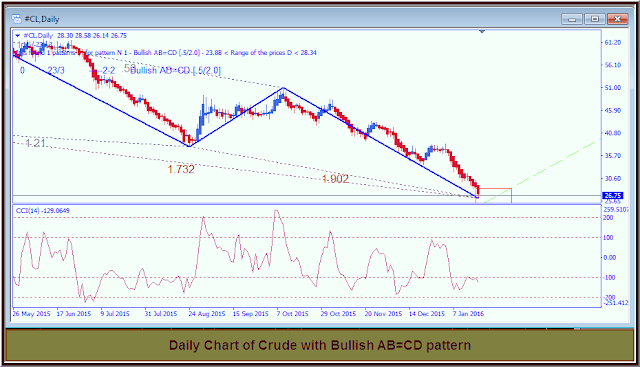
First the Daily Chart
You can see that there is a Bullish AB=CD pattern which indicates the market will be turning up.
You can also see that there is CCI Divergence on the chart, Bullish Regular Divergence.
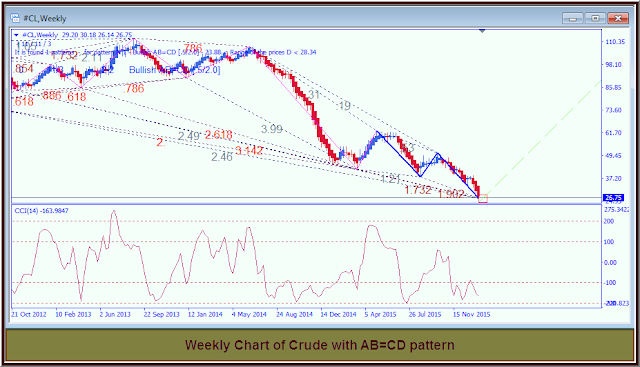
Next, The Weekly Chart
On this one is also an AB=CD Bullish Pattern, and also Bullish Regular Divergence
Note that the pattern started many months ago, on May 3, 2015 and is therefore a very strong Bullish pattern.
Now we can look at the Fibonacci Heading on the Monthly Chart
Here we have a Bullish Shark and what is interesting here is that the pattern started seven years ago…. this one is a powerful pattern.
Note the CCI indicator on this chart….There is a strong indication of Regular
Bullish Divergence forming.
Summary
Yes, today there was a bloodbath, the bears clobbered world markets and drove the price of Crude to new lows. And there may be more of this. That is the bad news. On the other hand there is a recovery at hand as indicated by these Fibonacci Patterns.
Very soon we will see a reversal in this market, I expect a significant rebound as the shorts have to cover in the next few days.
There was a bit of an uptick in after hours trading today and that may continue as the Asian markets open.
In any event, by the use of
Fibonacci Patterns we can evaluate what will be happening in the not too distant future.
UPDATE
As I post this, the price of Crude has rebounded to 28.56Here are some comments about Crude Oil and markets in general.
Dow plunges, recovers more than half its losses as crude oil sinks to 13-year low - Fox News
Wed, 20 Jan 2016 21:16:43 GMT Energy companies were pummeled as the latest fall in the price of oil threatened more damage to an industry that has already been stricken with bankruptcies, layoffs and other cutbacks. U.S. crude fell below $27 a barrel amid a global glut in oil ...
US crude falls toward $26 ahead of contract expiry - CNBC
Wed, 20 Jan 2016 21:42:00 GMT U.S. oil recorded its worst settlement since May 2003 on Wednesday, caught in a broad slump across world financial markets with traders also fearful that the crude supply glut could last longer. U.S. benchmark West Texas Intermediate (WTI) prices for?...
Crude Oil Prices In 2016: Made In China? - Forbes
Wed, 20 Jan 2016 15:42:52 GMT The year 2016 has started on a shaky note for the commodity markets. The global benchmarks for crude oil – Brent and WTI – have plunged close to 20% since the beginning of the year, hitting their 13-year lows of under $30 per barrel, as the market ...WTI oil settles at nearly 13-year low below $27 a barrel


")