Tampilkan postingan dengan label 13. Tampilkan semua postingan

Rabu, 11 Mei 2016

5 And 13 Exponential Moving Average Profitable Forex Strategy - forex trading tips and tricks

5 And 13 Exponential Moving Average Profitable Forex Strategy ~ forex trading tips and tricks


Strategy

Take from Fibonacci sequence numbers 5 and 13 as the parameters for moving averages. When you wish to determine the price movement, the time for opening and closing the positions, use Exponential
Moving Average (EMA) 5 and 13 indicators and follow these rules:
Open the position when EMA5 has crossed EMA13.


Click image for larger version Name: Untitled-1.jpg Views: 0 Size: 44.4 KB ID: 12333


Buy when EMA5 has crossed EMA13 from below.
Sell when EMA5 crosses EMA13 from above. Wait until the time interval (selected by you) closes. If by this time EMA5 and EMA13 have crossed each other, enter the market at the price of opening the following time interval.

Click image for larger version Name: Untitled-2.jpg Views: 0 Size: 36.3 KB ID: 12334


When opening the position – at the same time – you should place stop loss order below/above EMA13.
Close the position in case:
a) the closing price showed crossing or equality of EMA5 and EMA13;
b) the prices reached the level of your stop order.
These rules can be applied to all time interval. However the best results are achieved with one-hour
charts.
The following picture illustrates the rules.

To improve the results of your Forex trades, use these crucial rules: Place your stop orders at 50 pips level from EMA13, binding this level to EMA13 movements; of course, if the market trend goes as it was expected.
This tactics will give you the possibility to avoid non-predictable market movements.


Click image for larger version Name: Untitled-3.jpg Views: 0 Size: 35.6 KB ID: 12335

Do not open the position if there is a gap of more than 100 pips between the opening price and the level of stop loss order. This rule will protect you from big market movements which take place during a very short time interval (see below image)

Click image for larger version Name: Untitled-4.jpg Views: 0 Size: 34.6 KB ID: 12336

Do not open the position when there is only 1 pip between EMA5 and EMA13. Wait until the time interval is closed with more sufficient difference between EMA5 and EMA13 (see below image)

Click image for larger version Name: Untitled-5.jpg Views: 0 Size: 34.0 KB ID: 12337

You should set up for yourself a certain maximum sum which you are ready to lose on every trade (risk percentage). It should not be more than 10% of the total sum on your account.

More info for 5 And 13 Exponential Moving Average Profitable Forex Strategy ~ forex trading tips and tricks:

Jumat, 06 Mei 2016

CCI Trading Strategy as At August 13 (updated) - forex trading account singapore

CCI Trading Strategy as At August 13 (updated) ~ forex trading account singapore


Using CCI For Some Simple Entries On Today’s Charts.


CCI Divergence
Here is a one hour chart of EURUSD showing some Bullish Divergence

image


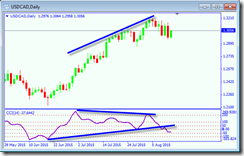
and the Daily USDCAD showing Bearish Divergence

image


Now we can apply the CCI 200 Trend Line break:

image


image


You can see that the entries are quite clear cut and also accurate.

I will look for a couple examples of CCI Slingshot entries from today’s charts.

Here is CADJPY daily. You can see the slingshot here, the CCI 14 has risen to the zero line while the CCI 6 has climbed to the 100 level.

image


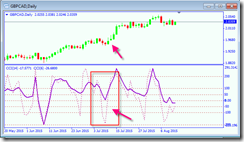
On the GBPCAD Daily chart is a great example of the CCI Slingshot. If you check the price bars you will see that this is a great continuation entry that yielded quite a few pips.

image


CCI is a great scalping tool, you can use it on the fast time frames as well as the slower time frames. It takes a few hours of screen time to get your eyes used to picking out the entries.

CCI Divergence is quite useful and often very easy to see on a chart, particularly if you are used to drawing trend lines.

There is a few examples from the charts this morning, I know there are many more available for some profitable trade entries.
More info for CCI Trading Strategy as At August 13 (updated) ~ forex trading account singapore:

Senin, 02 Mei 2016

Some Important Point and Figure Charts for your Trading Strategy as at January 13 (updated) - algorithms for forex trading

Some Important Point and Figure Charts for your Trading Strategy as at January 13 (updated) ~ algorithms for forex trading


These charts indicate that there will be some great moves as time passes, hopefully some nice trends in the months to come


More info for Some Important Point and Figure Charts for your Trading Strategy as at January 13 (updated) ~ algorithms for forex trading:

Selasa, 26 April 2016

Yield Curve Articles as at August 13 (updated) - forex trading account malaysia

Yield Curve Articles as at August 13 (updated) ~ forex trading account malaysia


How will the bond trading strategies play out?


Here is the Bloomberg chart for

US Generic Govt 10 Year Yield as at 9 am


image


Here are is a group of current articles expressing several different opinions


Why Nomura Likes Annaly & American Capital Agency Right Now - Benzinga
http://news.google.com Wed, 12 Aug 2015 23:32:47 GMT
BenzingaWhy Nomura Likes Annaly & American Capital Agency Right NowBenzingaAdditionally, because of this slow movement, Nomura expects "…the yield curve (2yr versus 10yr UST yields) to pancake or flatten out dramatically from present levels over the ...
Read more ...
Investment-Grade Corporate Bond Yields Hit another 2015 High - Market Realist
http://news.google.com Wed, 12 Aug 2015 13:42:24 GMT
Investment-Grade Corporate Bond Yields Hit another 2015 HighMarket RealistLast week, Treasury yields at the short and intermediates end of the yield curve mostly rose while long-term yields fell. Investment-grade corporate bonds, which tend to follow ...
Read more ...
Monetary policy - EU News
http://news.google.com Thu, 13 Aug 2015 11:38:07 GMT
Monetary policyEU NewsThe largest yield changes had taken place at longer maturities, leading to a further steepening of the yield curve, whereas the short end of the curve remained well anchored. The bond yields of several other euro area countries ...
Read more ...
Economic Indicators Affect Investment-Grade Bond Yield Movement - Market Realist
http://news.google.com Wed, 12 Aug 2015 13:41:40 GMT
Market RealistEconomic Indicators Affect Investment-Grade Bond Yield MovementMarket RealistLast week, Treasury yields at the short and intermediates end of the yield curve mostly rose while long-term yields fell. Investment-grade corporate bonds, whi ...
Read more ...
Near-Term Risk-Reward Not Attractive For Australian Equities: Macquarie - ValueWalk
http://news.google.com Thu, 13 Aug 2015 07:49:17 GMT
ValueWalkNear-Term Risk-Reward Not Attractive For Australian Equities: MacquarieValueWalk... traditionally Australian equities have performed strongly into the start of a U.S. rate tightening cycle rising on average ~10% in the following 12 months. T ...
Read more ...
The Macro Environment Roundup - TheStreet.com
http://news.google.com Mon, 10 Aug 2015 14:02:24 GMT
The Macro Environment RoundupTheStreet.comAs Yogi Berra noted, you can observe a lot just by watching. This weeks fun fact: The Eurodollar yield curve is lower now than it was following the May employment report, released in June, but the Federal Re ...
Read more ...
JGBs gain as US jobs data flattens Treasuries yield curve - Reuters
http://news.google.com Mon, 10 Aug 2015 05:40:00 GMT
JGBs gain as US jobs data flattens Treasuries yield curveReutersThe 10-year Japanese government bond yield dipped 1.0 basis point to 0.405 percent, while the price of 10-year JGB futures rose 0.12 in price to 147.62. The 30-year JGB yield also fell 1 ...
Read more ...
Heres why the yield curve is acting so weird - Business Insider
http://news.google.com Wed, 12 Aug 2015 15:15:20 GMT
Business InsiderHeres why the yield curve is acting so weirdBusiness InsiderWhile the short end of the bond market seems to agree, longer-dated yields have been living a life of their own, with 10-year yields down some 35 basis points (bps) from the ...
Read more ...


More info for Yield Curve Articles as at August 13 (updated) ~ forex trading account malaysia:

Selasa, 19 April 2016

EURUSD Trading Strategy as at August 13 (updated) - forex trading account opening

EURUSD Trading Strategy as at August 13 (updated) ~ forex trading account opening


What Trading Strategy For The Euro Today?


After a great gain on Wednesday, the Euro seems to be backing off from resistance today. The CCI shows overbought on the daily chart.
There is mixed opinions as to the Yuan moves and how they will be affecting the Euro.

Here is a daily chart

image


You can see the divergence on the 4 hour chart, the market seems undecided as to bull or bear.

image


I have gathered some articles to provide some opinions as to what the writers foresee.


EUR/USD Rally to Fizzle on Strong U.S. Retail Sales - DailyFX
http://news.google.com Thu, 13 Aug 2015 08:01:57 GMT
DailyFXEUR/USD Rally to Fizzle on Strong U.S. Retail SalesDailyFXNeed red, five-minute candle following a positive print to consider a short EUR/USD trade. If market reaction favors a bullish dollar trade, sell EUR/USD with two separate position. Set ...
Read more ...
EUR/USD: Trading the Preliminary German GDP - Forex Crunch
http://news.google.com Thu, 13 Aug 2015 09:37:00 GMT
FX EmpireEUR/USD: Trading the Preliminary German GDPForex CrunchGross Domestic Product (GDP) indicator is a measurement of the production and growth of the economy. Analysts consider GDP one the most important indicators of economic activity. A readi ...
Read more ...
EUR/USD: Has The USD Peaked? - BofA Merrill - eFXnews
http://news.google.com Thu, 13 Aug 2015 03:07:01 GMT
EUR/USD: Has The USD Peaked? - BofA MerrilleFXnews"This suggests monetary policies will likely be looser for the ECB than for the Fed for years to come, which is consistent with a weak EUR/USD, even in the medium to long term. Better Eurozone data wi ...
Read more ...
EUR/USD Technical Analysis: Euro Gains Most in a Month - DailyFX
http://news.google.com Thu, 13 Aug 2015 04:19:22 GMT
DailyFXEUR/USD Technical Analysis: Euro Gains Most in a MonthDailyFXThe Euro rose for a sixth consecutive day, putting in the largest daily advance in a month against the US Dollar. Near-term resistance is at 1.1195, the 61.8% Fibonacci retracement, ...
Read more ...
How CNY Devaluation Will Eventually Lead To EUR/USD Selling - BNPP - Forex Crunch
http://news.google.com Thu, 13 Aug 2015 10:12:00 GMT
Forex CrunchHow CNY Devaluation Will Eventually Lead To EUR/USD Selling - BNPPForex Crunch4- “The associated portfolio rebalancing would require EURUSD selling,” BNPP argues. 5- “Partially offsetting some of the USD-bullish trend may be reduced FOMC ...
Read more ...
EUR/USD Mid-Session Technical Analysis for August 13, 2015 - FX Empire
http://news.google.com Thu, 13 Aug 2015 10:08:00 GMT
FX EmpireEUR/USD Mid-Session Technical Analysis for August 13, 2015FX EmpireThe EUR/USD is trading lower at the mid-session. There was no follow-through to the upside after yesterdays strong surge, giving long investors an excuse to book profits. Th ...
Read more ...
EUR/USD Touches July High, Gains 110 Pips - Action Forex
http://news.google.com Thu, 13 Aug 2015 08:44:00 GMT
EUR/USD Touches July High, Gains 110 PipsAction ForexEUR/USD surged the most since Jul 29 on fears the Fed may not hike rates in September. As a result, the Euro pierced through a resistance zone at 1.1080, reached a daily high at 1.1216 (Jul high), ...
Read more ...


More info for EURUSD Trading Strategy as at August 13 (updated) ~ forex trading account opening:

Minggu, 10 April 2016

3 Ways To Identify A True Trend In Forex Trading - best forex trader advice

3 Ways To Identify A True Trend In Forex Trading ~ best forex trader advice


In the foreign exchange markets, like in many other markets,there are two basic types of trading environments – a trend and a range. A trend can be defied as a general move in one direction while a range is an oscillation in price between two broad levels. In stocks, we typically try to “buy low” (at a value) and“sell high”; this is actually the foundation of range trading.

We Attempt To Outline Three Simple Methods To Identify A Trend:


» Bollinger Bands
» Moving averages
» ADX


Bollinger Bands


Bollinger Bands basically plot standard deviations above and below a moving average. They were developed in the early 1980sby John Bollinger and are typically used to determine volatility. At GFT, however, we like to use Bollinger Bands to help us gauge atrend.

In the chart below, we plotted a set of standard Bollinger Bands using the settings 20,2 (which mean two standard deviations awayfrom the 20-day moving average) and then added a set of 20,1 Bollinger Bands (one standard deviation away from the 20-daymoving average). This helps us to create our buy zone and sell zone.

Typically, when an uptrend in a currency pair is very strong, it will remain in the buy zone, the zone between the upper Bollinger Band of two standard deviations and the upper Bollinger Band of one standard deviation, for some time. When the downtrend is very strong, the currency pair will remain within in the sell zone, the zone between the lower Bollinger Band of two standard deviations and the lower Bollinger Band of one standard deviation. If the currency pair closes below the buy zone or above the sell zone,we say that it has entered the range trading zone.

Bollinger Bands are great tools to use to help determine when a currency pair enters or exits a trend. For those traders who like topick tops and bottoms, a good way to do so is to wait for the currency pair to exit the buy or sell zones.

Click image for larger version Name: Bollinger-Bands.jpg Views: 1 Size: 16.8 KB ID: 12403

Moving Averages


Moving averages is another great tool for identifying a trend in the currency market. By defiition, moving averages track the average price of a currency pair over a specifid period of time. A 20-day Simple Moving Average (SMA), for example, tracks the average price of a currency pair over the past 20 days.

One way to identify trends with moving averages is to look for a perfect order. This occurs when all of the shorter term moving averages are above the longer term moving averages in an uptrend and the longer term moving averages are above the shorter term moving averages in a downtrend. We usually see a new and powerful trend emerge when these perfect orders form after a period of range trading.

Here is an example in the GBP/USD pair where moving averages are lined up in a perfect order. As you can see in the chart below, the 10-day SMA is below the 20-day SMA, which is below the 50-day SMA and those are below the 100-day and 200-day SMAs.We have also highlighted the day that the perfect order formed (August 11, 2008). At that time, the GBP/USD was trading at 1.9100. Forty days later when the perfect order breaks ranks on September 22, 2008, the GBP/USD was trading at 1.8572 or 500
pips lower.

Perfect orders do not form often, but when they do, they can provide a powerful sign that a new trend has emerged.

Click image for larger version Name: Moving-Averages.jpg Views: 0 Size: 20.4 KB ID: 12404

ADX (Average Directional Index)


The ADX is short for the Average Directional Index, which is a classic measure of a trend’s strength. Unlike Bollinger Bands and moving averages which can help defie the direction of the trend, the ADX simply measures whether the trend is strong or weak.The index is displayed as an oscillator in a separate box below the price charts on a scale of 0 to 100.
As a rule of thumb, if the ADX is greater than 30, a trend is strong; if ADX is below 20, a trend is weak. In a strong trend, we want to see the ADX sloping upwards. In the following EUR/USD chart, we inserted vertical lines to represent the times when ADX crosses the 30 mark.
Back in March 2008, for example, the ADX crossed above the 30 mark when the currency pair was trading at 1.52. Over the next month, the currency pair gained strength at a relatively rapid pace and ended up hitting a high above 1.60. When the ADX crossed back below the 30 mark, the currency pair ended up range trading for the next few months before breaking lower in the middle of July.

Click image for larger version Name: ADX.jpg Views: 0 Size: 19.6 KB ID: 12405

More info for 3 Ways To Identify A True Trend In Forex Trading ~ best forex trader advice:

Selasa, 05 April 2016

Australian Dollar AUD Slides To 3 Week Low Against USD 25 01 13 - forex trading classes malaysia

Australian Dollar AUD Slides To 3 Week Low Against USD 25 01 13 ~ forex trading classes malaysia


Downtrend Continue in AUD counter - Asian Morning trade
Australian Dollar (USD) continue slides against its biggest counter part American Dollar (USD ) .Extending yesterdays( 24/01/2013) downtrend, the Australian dollar reached 1.0441 against its USD on Friday Morning Trade. Now the AUDUSD pair trading its weakest level since January 4. 

At Thursdays Latin American close, the Australian dollar (AUD) was worth 1.0454 against the Major pair US Dollar. The near-term bias is bearish for Australian Dollar (AUD) at the moment. AUD/USD pair is poised to pierce its 100-day simple moving average level of 1.0420 in Fridays trade.


More info for Australian Dollar AUD Slides To 3 Week Low Against USD 25 01 13 ~ forex trading classes malaysia: